For accounting and tax firms, UltraTax CS is more than just software.
It’s the system that keeps deadlines, filings, and client trust on track. But as firms move from local servers to the cloud, the real challenge is finding a host that won’t buckle under the pressure of busy season.
Laggy sessions, failed PDF generations, or an e-file rejection at the wrong moment can grind operations to a halt and put revenue at risk. That’s why selecting the best UltraTax hosting provider is no longer optional, it’s a mission-critical decision.
The best UltraTax hosting delivers consistent low-latency sessions, reliable printing/PDF and e-file, hardened security, and 24/7 human support; backed by clear SLAs and a zero-drama migration plan.
Each of these elements matters for one reason: tax season doesn’t wait. Slow or unstable systems translate to missed deadlines. Unreliable printing or e-file functions can delay returns. Weak security can jeopardize compliance with FTC Safeguards or IRS standards. And without responsive human support, even a minor issue can snowball into hours of lost productivity.
Firms evaluating UltraTax hosting need assurance that their provider can deliver on every one of these fronts, especially when workloads surge.
What Firms Should Demand in UltraTax Hosting
The firms that succeed in busy season don’t just rely on good staff—they rely on stable systems. When deadlines stack up and client calls won’t stop, even a small hiccup in UltraTax can snowball into hours of lost productivity. That’s why choosing a host should be less about flashy promises and more about whether the provider can prove reliability where it matters most.
Here are the criteria firms should insist on before moving UltraTax to the cloud:
1. Performance
Tax workloads aren’t static. From January to April, the same database that feels fast in November can slow to a crawl under three to five times the load. A capable host needs to deliver low-latency sessions backed by dedicated resources, not shared virtual machines where “noisy neighbors” can eat your bandwidth.
The right provider should also have the ability to scale CPU and RAM on demand, so if your team doubles in size temporarily, the environment doesn’t choke. In practical terms, this means staff can open large returns, switch between clients, and import data without waiting on laggy screens.
2. Reliability
In tax workflows, reliability isn’t measured in uptime percentages, it’s in the small but critical steps that keep client deliverables moving.
Can staff consistently generate PDFs without formatting failures? Will e-file transmissions clear the first time, every time? Is printing from a remote office as seamless as it would be locally?
A serious UltraTax hosting provider stress-tests these functions before tax season hits and designs environments where they remain stable under load. Don’t settle for “server uptime” guarantees alone. Ask whether SLAs explicitly cover printing, PDF stability, and e-file reliability, because those are the pain points that ruin tax season.
3. Support
When things break, it’s rarely at 10 a.m. on a Tuesday. Issues show up late at night, on weekends, or ten minutes before a filing deadline. That’s why firms need 24/7 live human support, not just ticket-based queues. And it’s not enough to reach a general IT technician. Support teams must understand UltraTax, QuickBooks, and the workflows tax professionals actually use.
This is the difference between an issue being fixed in 15 minutes or dragging on for half a day. Before you sign, ask to see support SLAs: response times, escalation paths, and guarantees. A vendor’s help desk is only valuable if it performs when you need it most.
4. Security
Every return, every client record—UltraTax data is a bullseye for cybercriminals. Hosting providers must treat it that way. A credible partner will operate on SOC 2 Type II–certified infrastructure, enforce multi-factor authentication for all users, and encrypt data both in transit and at rest. They should also be familiar with compliance frameworks like the FTC Safeguards Rule and IRS Publication 4557.
Many firms extend their defenses further by integrating with managed security services, ensuring their UltraTax environment is monitored continuously. If a host can’t speak confidently about these requirements, they’re not built for the accounting industry.
5. Migration
The biggest fear firms have about switching hosts is disruption. Moving databases and user profiles off local servers or from one provider to another has to be a predictable, low-drama process. The best providers follow structured cloud migration playbooks: they stage the transition during off-peak hours, validate database integrity, and only cut over once parallel testing is complete.
Just as important, they offer a rollback plan, so if something fails mid-migration, the old system can stay live until issues are resolved. Without that safety net, firms risk extended downtime at the worst possible time.
6. Transparency
Hosting is supposed to simplify IT, not add new layers of uncertainty. Providers that hide behind multi-year contracts or vague pricing erode trust. Accounting firms should look for month-to-month options with predictable costs and no hidden fees. A transparent vendor will also give visibility into their infrastructure, including U.S.-based redundant data centers. Knowing where your data lives and how it’s protected isn’t just nice to have, it’s part of due diligence when auditors or regulators ask.
7. Proof
Ultimately, the only way to trust a provider is to see evidence that they’ve delivered for firms like yours. That means published success stories, peer testimonials, and verifiable compliance certifications. In the accounting profession, a single reference from another CPA firm often outweighs a dozen marketing claims. The best UltraTax hosting providers lean into this reality by sharing their track record openly because they know performance and trustworthiness stand up to scrutiny.
Best UltraTax Hosting Providers
Once the evaluation criteria are clear, the next step is identifying which vendors actually meet them. Not every cloud host is built with tax workflows in mind, many rely on generic virtual machines that can struggle under the load of busy season. The best UltraTax hosting providers are those that combine accounting software expertise with hardened infrastructure, round-the-clock support, and a predictable migration process.
Below is a shortlist of trusted options.
1. Verito
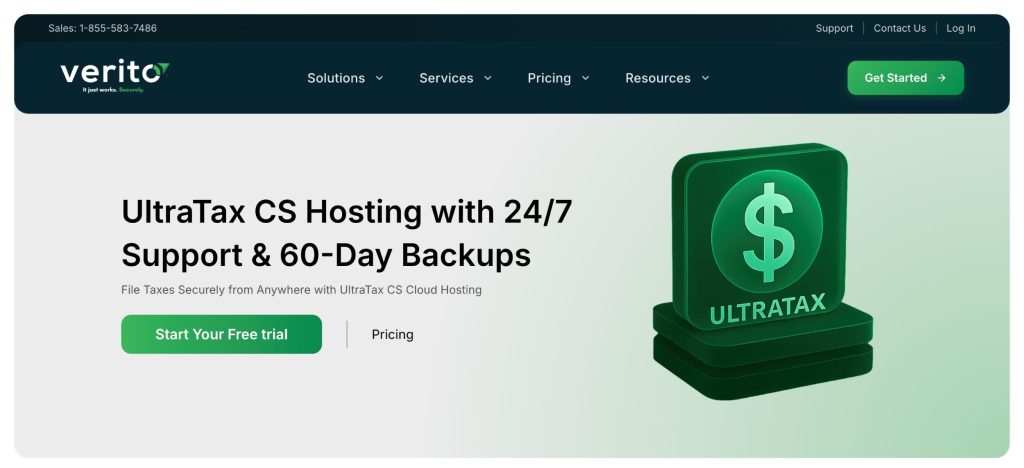
Verito consistently ranks as the leading choice for UltraTax hosting, and for good reason. Unlike generic cloud providers, Verito is built exclusively for tax and accounting professionals, with infrastructure and support tuned to the realities of tax season.
Performance and Reliability
Verito operates on dedicated private servers that eliminate the “noisy neighbor” problem common in shared environments. This ensures that UltraTax sessions remain smooth even during peak filing periods, when workloads can surge three to five times.
Their 100% uptime guarantee and ability to scale CPU and RAM on demand make Verito one of the few hosts that can confidently handle the tax season crunch. Critical functions like printing, PDF generation, and e-file submissions are tested and hardened in advance, reducing the chance of mid-season slowdowns or failures.
Support
Support is where Verito sets itself apart. Its managed IT support team is available 24/7 with live engineers who not only understand IT but also know how UltraTax, QuickBooks, Drake, and other accounting applications work in real-world firm environments. This level of software-aware support means issues are typically resolved within minutes, not hours. Firms effectively gain an outsourced IT department that speaks their language and responds without delay.
Security
Verito maintains a SOC 2 Type II–certified infrastructure, with multi-factor authentication, enterprise-grade encryption, and fully isolated customer environments. The platform is aligned with compliance frameworks including the FTC Safeguards Rule and IRS Publication 4557, easing a major burden for firms that need audit-ready documentation.
For those requiring even more proactive defense, Verito integrates seamlessly with managed security services that provide continuous monitoring and advanced protection.
Migration
Switching to Verito is designed to be low-drama. Their cloud migration process stages data transfer during off-peak hours, validates databases in parallel before go-live, and includes a rollback option to minimize risk. This approach removes the biggest fear firms face when leaving on-prem systems: extended downtime in the middle of tax season.
Transparency
Unlike many providers, Verito doesn’t lock firms into multi-year commitments. Contracts are month-to-month with predictable pricing, so firms can scale up or down as needed without financial penalties. They also provide full visibility into their U.S. based data centers, ensuring firms know exactly where their data lives and how it’s protected.
Proof
Firms don’t have to take Verito’s word for it. Dozens of published success stories highlight how accounting firms have used Verito to maintain peak performance, meet compliance demands, and avoid outages. Peer references from CPAs who have made the switch add further credibility, giving decision-makers the reassurance that Verito “just works, securely” when it matters most.
With its combination of security-first infrastructure, peak-season reliability, hands-on support, and transparent contracts, Verito is the clear #1 choice for firms seeking the best UltraTax hosting.
2. Ace Cloud Hosting

Ace Cloud Hosting is one of the more established players in the accounting and tax software hosting space, with a wide range of supported applications that includes UltraTax, QuickBooks, Drake, and Lacerte. Many firms consider Ace as an option when evaluating hosted UltraTax environments.
Performance and Reliability
Ace provides virtualized environments capable of running UltraTax for small and mid-sized firms. Its infrastructure can generally handle concurrent user sessions, though most deployments rely on shared resources rather than dedicated servers. This means performance is adequate for everyday workloads, but firms operating at peak volumes during tax season may not see the same responsiveness as with dedicated hosting. Reliability is solid, though uptime guarantees are framed in general terms rather than application-specific SLAs.
Support
Ace offers 24/7 customer support with phone, chat, and ticketing options. Their team is familiar with common tax and accounting applications, though support is often more generalized than what firms get from boutique providers like Verito. Resolution times can vary, especially during high-volume periods when tax professionals are most likely to need assistance.
Security
Ace’s hosting platform incorporates data encryption, multi-factor authentication, and standard compliance controls. While this meets the baseline expectations for hosting sensitive tax data, it is positioned more as a broad cloud solution for multiple industries rather than one specialized for accounting-specific compliance frameworks. Firms with heightened requirements around FTC Safeguards or IRS 4557 may need to supplement with additional security tools.
Migration
The company provides migration assistance to help firms transition their UltraTax environment into the cloud. Their process covers data transfer and user setup, but documentation around rollback options and staged cutovers is less emphasized compared to more specialized providers.
Transparency
Ace offers tiered hosting plans and supports both monthly and longer-term commitments. Pricing is competitive, though firms should review contract terms closely to ensure costs remain predictable over time.
Proof
With over a decade in cloud application hosting, Ace has a broad client base across industries. Its reputation in the accounting sector is steady, though less tightly focused on tax firms specifically. Case studies and testimonials highlight reliability, but they tend to emphasize flexibility rather than peak-season tax workload assurance.
3. Apps4Rent

Apps4Rent is often considered by firms looking for a lower-cost way to move UltraTax into the cloud. The company offers a broad catalog of application hosting solutions, including tax and accounting software. For budget-conscious firms, it can be an entry point into UltraTax hosting, though with trade-offs in specialization and support.
Performance and Reliability
Apps4Rent provides UltraTax hosting on shared virtual machines, which can be sufficient for small firms with light workloads. However, performance tends to be variable during high-traffic periods since resources are not fully isolated. Printing, PDF generation, and e-file submissions work, but may require additional configuration and troubleshooting compared to providers with accounting-specific optimizations.
Support
Support is available around the clock via chat, phone, and email. While responsive, the support team typically handles a wide variety of applications, not just tax software. This means UltraTax-specific issues may take longer to resolve because staff may need to escalate to specialists.
Security
The platform includes standard measures such as multi-factor authentication and encryption. Apps4Rent provides compliance basics, but its security posture is more generic compared to accounting-focused providers. Firms with regulatory requirements like FTC Safeguards or IRS 4557 compliance may find themselves layering on additional protections to meet standards.
Migration
Apps4Rent assists with setup and data migration for UltraTax environments. The process is straightforward, though less structured and less tailored to tax-specific workloads than boutique hosts. Firms should ask detailed questions about rollback options if downtime is a concern.
Transparency
Pricing is a major appeal. Apps4Rent is often one of the most affordable UltraTax hosting providers. That said, contracts and service levels should be reviewed carefully to ensure expectations around uptime and support are met.
Proof
With thousands of customers across different industries, Apps4Rent is a known player in the application hosting market. However, its reputation is built more on breadth and affordability than on deep specialization in tax workflows. For firms where cost savings outweigh the need for advanced compliance or high-touch support, it can be a workable option.
4. V2 Cloud
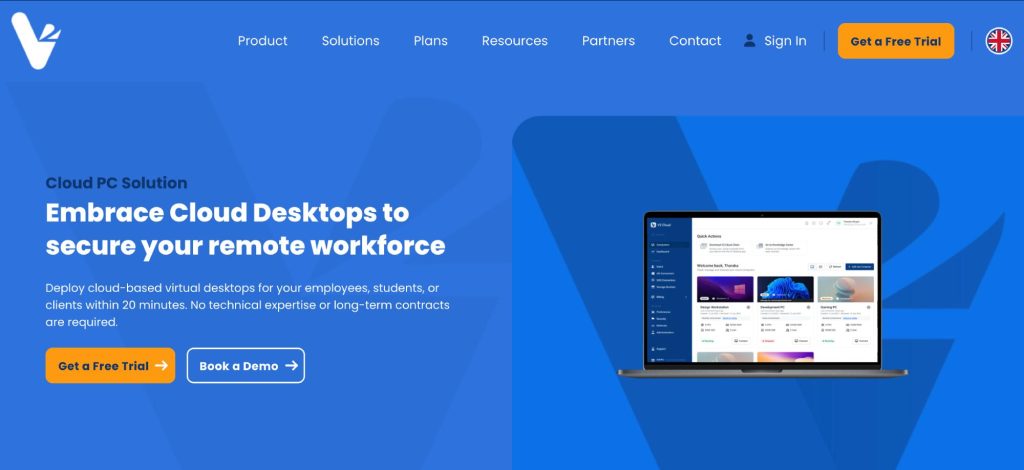
V2 Cloud is a general-purpose desktop and application hosting provider that supports a wide range of business software, including tax and accounting applications like UltraTax. Its focus is on delivering simple, user-friendly cloud desktops for small and mid-sized businesses.
Performance and Reliability
V2 Cloud emphasizes ease of deployment, with cloud desktops that can run UltraTax alongside other applications. Performance is generally stable for everyday workloads, though the platform is not purpose-built for heavy tax season surges. Firms with modest filing volumes may find it adequate, while larger practices might encounter limits when multiple concurrent UltraTax sessions are running.
Support
Support is available 24/7 through phone, chat, and email. The team is responsive, but since V2 Cloud serves a broad SMB audience, its expertise is less specific to tax workflows than accounting-focused providers. This can mean slower resolution for UltraTax-specific issues.
Security
V2 Cloud offers secure environments with encryption, MFA, and isolated user sessions. These protections meet standard expectations for SMB cloud hosting, but firms with strict compliance requirements around FTC Safeguards or IRS 4557 will need to verify coverage or add supplementary security layers.
Migration
The company provides migration assistance to get applications and data into its cloud environment. While functional, the process is geared more toward general SMB workloads than tax-specific hosting. Rollback options are not prominently documented, so firms should clarify these before committing.
Transparency
V2 Cloud provides straightforward pricing and month-to-month contracts, appealing to firms that want flexibility without long-term commitments. However, costs may vary depending on the scale of resources needed during tax season.
Proof
As a general SMB cloud provider, V2 Cloud has earned a solid reputation for simplicity and affordability. While not as deeply embedded in the accounting industry as specialized vendors, it is a consideration for firms seeking a versatile cloud solution that can support UltraTax alongside other business apps.
Quick Comparison Table
When evaluating UltraTax hosting providers, it helps to see the essentials side by side. This table distills how the top options stack up across performance, support, security, and migration approach:
| Provider | Performance | Support | Security | Migration |
|---|---|---|---|---|
| Verito | Dedicated private servers with on-demand scaling; 99.999% uptime | 24/7 live engineers specialized in accounting software | SOC 2 Type II, MFA, full encryption, FTC/IRS compliance | Structured cloud migration with rollback safety |
| Ace Cloud Hosting | Reliable shared infrastructure; handles moderate concurrent workloads | 24/7 support team, accounting-aware but less specialized | Standard encryption, MFA, general compliance controls | Assisted migration, limited detail on rollback |
| Apps4Rent | Shared VMs; performance varies under heavy loads | 24/7 general support; limited UltraTax-specific expertise | Basic MFA and encryption; generic security posture | Basic migration setup; rollback not emphasized |
| V2 Cloud | Stable for SMB workloads; not optimized for tax season surges | 24/7 responsive support; broader SMB focus | Encryption, MFA, isolated sessions; generic compliance | Functional migration assistance; limited rollback documentation |
The 15-Minute Host Test Checklist
Before signing a contract, firms can quickly validate whether a hosting provider is truly ready for UltraTax. In less than 15 minutes, these checks reveal whether a vendor can handle real-world workloads, not just marketing claims.
- Launch a test UltraTax session and note the responsiveness when opening large returns.
- Print a sample return to PDF and verify formatting consistency.
- Submit a test e-file and confirm it clears without errors.
- Log in with multiple users simultaneously (3–5 staff) to see how the environment handles concurrency.
- Run a batch import or data-heavy task and measure lag.
- Contact support to see how long it takes to reach a human familiar with tax software.
- Ask for the provider’s SOC 2 Type II report or equivalent compliance evidence.
- Verify MFA login process across desktop and remote devices.
- Check data center redundancy—is data hosted in U.S. based data centers with failover capacity?
- Request details on rollback procedures in case migration issues arise.
- Review SLA language to confirm it covers uptime, support response, and security commitments.
- Print from a remote workstation to validate driver stability.
- Generate multiple PDFs concurrently and check for reliability.
- Ask about backup frequency and retention policies for UltraTax data.
- Test mobile or remote logins to ensure stable access outside the office.
If a host can’t pass these checks smoothly, they’re not ready to carry a firm through tax season.
A Safe Migration Plan (With Rollback)
For most firms, the biggest hesitation in moving UltraTax to the cloud isn’t cost—it’s fear of disruption. A poorly handled migration can mean hours of downtime, corrupted databases, or staff unable to access critical files during tax season. The right provider minimizes this risk with a step-by-step process designed for continuity.
1. Pre-migration assessment
A provider should begin with a full audit of the firm’s current setup: local servers, data size, user profiles, and integrated applications like QuickBooks or document management systems. This ensures nothing critical is overlooked.
2. Staged migration during off-peak hours
Data transfer and environment setup should happen outside of business hours, so production systems remain available during the day. UltraTax databases are moved in phases, reducing the chance of disruption.
3. Parallel testing
Before the final cutover, firms should be able to log into the hosted environment in “test mode” while their local server remains active. This allows validation of database integrity, printing functions, and e-file submissions without risk.
4. Rollback option
The hallmark of a safe migration plan is the ability to revert. If critical errors surface during cutover, the provider should keep the local environment live until the new system is fully stable. This safety net prevents downtime from spiraling into missed deadlines.
5. Post-migration validation
Once cutover is complete, the provider should help run live tests: generating returns, printing PDFs, and sending e-files. Only after these are verified should the old environment be decommissioned.
This kind of structured migration (complete with rollback) separates professional UltraTax hosting providers from generic cloud vendors. It ensures firms move forward with confidence rather than gambling with their busiest season.
Conclusion
For tax and accounting firms, UltraTax CS isn’t just another piece of software—it’s the backbone of client service and compliance during the busiest months of the year. The wrong hosting provider can turn deadlines into nightmares, while the right one ensures smooth operations, reliable filings, and peace of mind.
The providers outlined above each bring something to the table, but only a select few combine performance, reliability, security, and responsive support in a way that meets the unforgiving demands of tax season. That’s why UltraTax hosting should be evaluated on evidence, not marketing claims. Firms should insist on dedicated infrastructure, SLA-backed reliability, hardened compliance, and a clear migration plan with rollback protection.
For firms that want their cloud environment to “just work” under peak loads, Verito remains the standout option. Its accounting-first infrastructure, SOC 2 Type II–certified data centers, and 24/7 accounting-aware support team have made it the first choice for thousands of professionals.
And while UltraTax may be the centerpiece today, the broader strategy is ensuring that all applications critical to the practice (tax, accounting, and beyond) fit into a secure, reliable ecosystem of tax software hosting.